Minitab Study guides, Class notes & Summaries
Looking for the best study guides, study notes and summaries about Minitab? On this page you'll find 109 study documents about Minitab.
Page 2 out of 109 results
Sort by
-
Quantative methods statistiek + uitleg minitab
- Class notes • 79 pages • 2022
- $7.16
- 1x sold
- + learn more
Quantative methods statistiek + uitleg minitab
-
STAT 501 – Homework 5 Solutions Latest Verified Review 2023 Practice Questions and Answers for Exam Preparation, 100% Correct with Explanations, Highly Recommended, Download to Score A+
- Exam (elaborations) • 6 pages • 2023
- $2.99
- + learn more
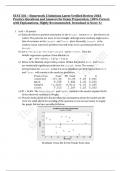
STAT 501 – Homework 5 Solutions Latest Verified Review 2023 Practice Questions and Answers for Exam Preparation, 100% Correct with Explanations, Highly Recommended, Download to Score A+ 1. (6x5 = 30 points) (a) Each plot shows a positive association. In the Weight versus Neck plot there is an outlier. The patterns are more or less straight, although some students might note a hint of curvature in the Length and Chest plots. Generally, Length is the weakest (most scattered) predictor but stil...
-
QMB 3200 Exam 3 |Complete Questions with 100% Correct Answers
- Exam (elaborations) • 7 pages • 2024
- $10.50
- + learn more
QMB 3200 Exam 3 |Complete Questions with 100% Correct Answers The variable selection procedure that identifies the best regression equation, given a specified number of independent variables, is: best-subsets regression. The mathematical equation that explains how the dependent variable y is related to several independent variables and has the form is called: a multiple regression model. A regression model between sales ( in $1,000) and unit price (x1 in dollars) and television advertisemen...
-
Solution Manual for Design and Analysis of Experiments, 10th Edition
- Exam (elaborations) • 710 pages • 2024
- $42.49
- + learn more
Solution Manual for Design and Analysis of Experiments, 10th Edition Solutions from Montgomery, D. C. (2019) Design and Analysis of Experiments, Wiley, NY 1-1 Chapter 1 Introduction Solutions 1.1S. Suppose that you want to design an experiment to study the proportion of unpopped kernels of popcorn. Complete steps 1-3 of the guidelines for designing experiments in Section 1.4. Are there any major sources of variation that would be difficult to control? Step 1 – Recognition of and s...
-
MATH-533 Week 1 Quiz – Download For Revision And Improve Your Grades
- Other • 2 pages • 2024
- $7.99
- + learn more
1. Graph the relative frequency histogram for the 300 measurements summarized in the relative frequency table to the right. 2. Would you expect the data sets that follow to possess relative frequency distributions that are symmetric, skewed to the right, or skewed to the left? Explain. Complete parts a through c below. 3. Consider the following sample of five measurements. 3, 4, 5, 2, 6 4. MINITAB was used to generate the histogram to the right. 5. A university’s language professors incorp...

As you read this, a fellow student has made another $4.70

-
LSSBB Grey Practice exam I Questions and Answers A+ 100% 2023-2024
- Exam (elaborations) • 19 pages • 2023
- $16.99
- + learn more
LSSBB Grey Practice exam I Questions and Answers A+ 100% 2023-2024 A run chart having 14 or more pints in a sequence alternating up and down is referred to as A. Shift B. Oscillations C. Cycle D. Same Value - CORRECT ANSWER-C. Cycle A car has to pass through 8 assembly lines, daily 200 cars pass through the line and has 2 defects daily. Calculate DPO A. 0. B. 0.125 C. 0.00125 D. 1.25 - CORRECT ANSWER-C. 0.00125 What is FMEA? A. Fast moving engineered automotive B. Foreign made el...
-
Samenvatting - Lean Six Sigma Green Belt
- Summary • 31 pages • 2023
- $18.76
- + learn more
Samenvatting van een boek, opgedeeld in hoofdstukken. De samenvatting gaat over Lean en Six Sigma, dit zijn methodes om de kwaliteit van wat je doet te verhogen. Hoofdstukken: Hoofdstuk 1: De geschiedenis van Lean en Six Sigma Hoofdstuk 2 Organisaties in context Hoofdstuk 3: denken in processen Hoofdstuk 4: Lean Hoofdstuk 5: Toyota Productie systeem Hoofdstuk 6: Statische procescontrole Hoofdstuk 7: Controle charts in minitab Hoofdstuk 8: Capability analysis Hoofdstuk 9: Mogelijke gron...
-
OE All Video Notes - Minitab & Statistics
- Summary • 21 pages • 2021
- $5.95
- 1x sold
- + learn more
Notes on the videos of operational excellence, so you don't have to watch them yourselves. Instructions on Minitab.
-
Stat 200 Final Exam
- Exam (elaborations) • 19 pages • 2023
- $14.49
- + learn more
On a recent survey, Stat 200 students were asked: How low must the temperature go (in degrees Fahrenheit) for you to stop wearing shorts when you are out and about, such as going to class. It was also determined whether the student was a female or male. The goal is to compare the responses for the two genders. In this instance, which is true about the two variables? - correct answer the explanatory variable is categorical and the response variable is quantitative Which is untrue about the...

-
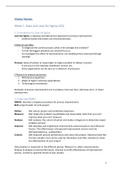
MATH 533 Week 7 Course Project Part C Regression and Correlation Analysis
- Exam (elaborations) • 15 pages • 2022
- $12.99
- + learn more
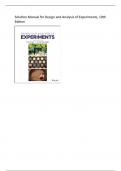
Running Head: Course Project Part C Regression Model MATH – 533 - 60846 Ans .1 Minitab Result Regression Analysis: Sales versus Calls Math 2 The regression equation is Sales = 9.638 + 0.2018 Calls 120 130 140 150 160 170 180 190 200 210 55 50 45 40 35 30 S 2.05708 R-Sq 75.9% R-Sq(adj) 75.7% Calls Sales Fitted LinePlot Sales= 9.638 + 0.2018 Calls It is evident with the help of scatter graph trend line that there is positive relationship between Sales and calls. If numbe...
