Math 302 quiz 5 Samenvattingen, Aantekeningen en Examens
Op zoek naar een samenvatting over Math 302 quiz 5? Op deze pagina vind je 201 samenvattingen over Math 302 quiz 5.
Alle 201 resultaten
Sorteer op

-
MATH 302| STATISTICS| WEEK 5 QUIZ WITH ANSWERS| 2024
- Tentamen (uitwerkingen) • 12 pagina's • 2024
- $10.49
- + meer info
MATH 302| STATISTICS| WEEK 5 QUIZ WITH ANSWERS| 2024

-
MATH 302 Week 5 Quiz - Question and Answers
- Tentamen (uitwerkingen) • 16 pagina's • 2023
- $14.99
- + meer info
MATH 302 Week 5 Quiz - Question and Answers

-
MATH 302 Week 5 Quiz - Question and Answers
- Tentamen (uitwerkingen) • 16 pagina's • 2023
- $17.49
- + meer info
MATH 302 Week 5 Quiz - Question and Answers

-
MATH 302 Quiz 5 – Question And Answers Set 1
- Tentamen (uitwerkingen) • 12 pagina's • 2023
- $10.49
- + meer info
MATH 302 Quiz 5 – Question And Answers Set 1

-
MATH 302| STATISTICS| WEEK 5 QUIZ WITH ANSWERS| 2024
- Tentamen (uitwerkingen) • 12 pagina's • 2024
- $10.99
- + meer info
MATH 302| STATISTICS| WEEK 5 QUIZ WITH ANSWERS| 2024

Wil jij je uitgaves terugverdienen?


-
MATH 302| STATISTICS| WEEK 5 QUIZ WITH ANSWERS| 2024
- Tentamen (uitwerkingen) • 12 pagina's • 2024
- $10.49
- + meer info
MATH 302| STATISTICS| WEEK 5 QUIZ WITH ANSWERS| 2024

-
MATH 302| STATISTICS| WEEK 3 QUIZ WITH ANSWER KEY| 2024
- Tentamen (uitwerkingen) • 8 pagina's • 2024
- $10.99
- + meer info
MATH 302| STATISTICS| WEEK 3 QUIZ WITH ANSWER KEY| 2024 If random variable X has a binomial distribution with n =10 and P(success) =p =0.2, find the probability that X is less than 6. (That is, find P(X<6) Answer: (round to 4 decimal places) Answer Key:0.9936|.9936 P(x < 6) = P(x is less than or equal to 5), in Excel =BINOM.DIST(5,10,0.2,TRUE) Approximately 8% of all people have blue eyes. Out of a random sample of 20 people, what is the probability that at most 2 of them have blue ...

-
MATH 302 QUIZ 2 – QUESTION AND ANSWERS SET 1
- Tentamen (uitwerkingen) • 10 pagina's • 2023
- $11.99
- + meer info
MATH 302 QUIZ 2 – QUESTION AND ANSWERS SET 1 Part 1 of 6 - 5.0/ 5.0 Points Question 1 of 20 1.0/ 1.0 Points A gumball machine contains 300 grape flavored balls, 400 cherry flavored balls, and 500 lemon flavored balls. What is the probability of getting 1 grape ball, 1 cherry ball, and 1 lemon ball if each ball was removed and then replaced before choosing the next from the machine? A.0.0264 B.0.0531 C.0.0347 D.0.0482 Answer Key: C Question 2 of 20 1.0/ 1.0 Points The numbe...
-
MATH 302 Quiz 1 Set 1
- Tentamen (uitwerkingen) • 11 pagina's • 2022
- $9.99
- + meer info
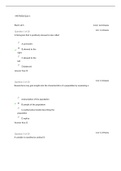
MATH 302 Quiz 1 1. An advertisement for a car states that it is 10% more powerful than its competitor. This is an example of 2. A scatterplot allows one to see: 3. Which of the following are the two most commonly used measures of variability? 4. A histogram that has a single peak and looks approximately the same to the left and right of the peak is called: 5. What kind of relationship between x and y is demonstrated by the scatter plot below? 6. Which of the following statements is true re...
-
MATH 302 Quiz 1 - Question and Answers
- Tentamen (uitwerkingen) • 11 pagina's • 2022
- $11.99
- + meer info
MATH 302 Quiz 1 Part 1 of 3 1. A histogram that is positively skewed is also called 2. Researchers may gain insight into the characteristics of a population by examining a 3. A variable is classified as ordinal if: 4. A sample of 20 observations has a standard deviation of 4. The sum of the squared deviations from the sample mean is: 5. A pareto chart does NOT have which of the following properties? 6. What type of graph is the figure below? 7. Numerical variables can be subdivided i...
