Math rlab Study guides, Class notes & Summaries
Looking for the best study guides, study notes and summaries about Math rlab? On this page you'll find 1 study documents about Math rlab.
All 1 results
Sort by
-
R Lab: normal distributions 1. As you can see, normal probability plots can be used both to assess normality and visualize skewness. Make a normal probability plot for female knee diameter (kne.di). Based on this normal probability plot, is this variable
- Other • 2 pages • 2023
- $3.49
- + learn more
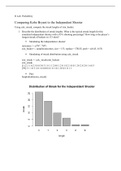
1. Now let’s consider some of the other variables in the body dimensions data set. Using the figures at the end of the exercises, match the histogram to its normal probability plot. All of the variables have been standardized (first subtract the mean, then divide by the standard deviation), so the units won’t be of any help. If you are uncertain based on these figures, generate the plots in R to check. 2. Note that normal probability plots C and D have a slight stepwise pattern. Why do you...

And that's how you make extra money

