Math 302 quiz 1 set 1 Study guides, Class notes & Summaries
Looking for the best study guides, study notes and summaries about Math 302 quiz 1 set 1? On this page you'll find 136 study documents about Math 302 quiz 1 set 1.
All 136 results
Sort by
-
MATH 302 Quiz 1 Set 1
- Exam (elaborations) • 11 pages • 2022
- $9.99
- + learn more
MATH 302 Quiz 1 1. An advertisement for a car states that it is 10% more powerful than its competitor. This is an example of 2. A scatterplot allows one to see: 3. Which of the following are the two most commonly used measures of variability? 4. A histogram that has a single peak and looks approximately the same to the left and right of the peak is called: 5. What kind of relationship between x and y is demonstrated by the scatter plot below? 6. Which of the following statements is true re...

-
MATH 302 QUIZ 2 – QUESTION AND ANSWERS SET 1
- Exam (elaborations) • 10 pages • 2023
- $11.99
- + learn more
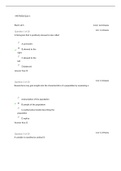
MATH 302 QUIZ 2 – QUESTION AND ANSWERS SET 1 Part 1 of 6 - 5.0/ 5.0 Points Question 1 of 20 1.0/ 1.0 Points A gumball machine contains 300 grape flavored balls, 400 cherry flavored balls, and 500 lemon flavored balls. What is the probability of getting 1 grape ball, 1 cherry ball, and 1 lemon ball if each ball was removed and then replaced before choosing the next from the machine? A.0.0264 B.0.0531 C.0.0347 D.0.0482 Answer Key: C Question 2 of 20 1.0/ 1.0 Points The numbe...
-
MATH 302 Quiz 1 - Question and Answers
- Exam (elaborations) • 11 pages • 2022
- $11.99
- + learn more
MATH 302 Quiz 1 Part 1 of 3 1. A histogram that is positively skewed is also called 2. Researchers may gain insight into the characteristics of a population by examining a 3. A variable is classified as ordinal if: 4. A sample of 20 observations has a standard deviation of 4. The sum of the squared deviations from the sample mean is: 5. A pareto chart does NOT have which of the following properties? 6. What type of graph is the figure below? 7. Numerical variables can be subdivided i...
-
MATH 302 Quiz 1 Set 3
- Exam (elaborations) • 9 pages • 2022
- $11.99
- + learn more
Math 302 quiz 1 1. What is the term for a characteristic or attribute that can assume different values? 2. A pareto chart does NOT have which of the following properties? 3. Suppose that a histogram of a data set is approximately symmetric and "bell shaped". Approximately what percent of the observations are within two standard deviations of the mean? 4. Suppose that a histogram of a data set is approximately symmetric and "bell shaped". Approximately, what percent of the observations ar...

-
MATH 302 Quiz 5 – Question And Answers Set 1
- Exam (elaborations) • 12 pages • 2023
- $10.49
- + learn more
MATH 302 Quiz 5 – Question And Answers Set 1

Make study stress less painful


-
MATH 302 Quiz 3 - Question and Answers
- Exam (elaborations) • 11 pages • 2022
- $13.99
- + learn more
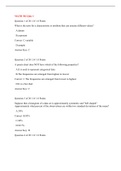
MATH 302 Quiz 3 - Question and Answers Find the area under the standard normal distribution to the left of z = -1.05. Round answer to 4 decimal places. Answer: .2299 Answer Key:0.1469|.1469 Feedback: In Excel, =NORM.S.DIST(-1.05,TRUE) Question 2 of 20 1.0/ 1.0 Points Find P(-1.96 ≤ Z ≤ 1.96). Round answer to 2 decimal places. Answer: .95 Answer Key:0.95|.95 Feedback: In Excel, =NORM.S.DIST(1.96,TRUE)-NORM.S.DIST(-1.96,TRUE) Question 3 of 20 1.0/ 1.0 Points Find P(1.31 &l...
-
MATH 302 QUIZ 2 – QUESTION AND ANSWERS SET 1 | 100% VERIFIED Q&AS | AMERICAN PUBLIC UNIVERSITY
- Exam (elaborations) • 10 pages • 2022
- $15.49
- + learn more
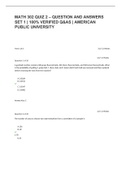
MATH 302 QUIZ 2 – QUESTION AND ANSWERS SET 1 | 100% VERIFIED Q&AS | AMERICAN PUBLIC UNIVERSITY

-
MATH 302 Final Exam Questions & Answers 2022 - American University | RATED A
- Exam (elaborations) • 116 pages • 2022
- $15.99
- + learn more
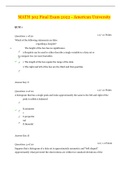
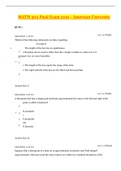
MATH 302 Final Exam Questions & Answers 2022 - American University | RATED AMATH 302 Final Exam 2022 - American University QUIZ 1 Question 1 of 20 1.0/ 1.0 Points Which of the following statements are false regarding a boxplot? A. The height of the box has no significance. B. Boxplots can be used to either describe a single variable in a data set or to compare two (or more)variables C. The length of the box equals the range of the data. D. The right and left of the box are th...
-
MATH 302 Final Exam QUESTIONS & ANSWERS 2022 UPDATE - American University
- Exam (elaborations) • 116 pages • 2022
- $14.99
- + learn more
MATH 302 Final Exam QUESTIONS & ANSWERS 2022 UPDATE - American UniversityMATH 302 Final Exam 2022 - American University QUIZ 1 Question 1 of 20 1.0/ 1.0 Points Which of the following statements are false regarding a boxplot? A. The height of the box has no significance. B. Boxplots can be used to either describe a single variable in a data set or to compare two (or more)variables C. The length of the box equals the range of the data. D. The right and left of the box are the t...
-
Math 302 Final Exam 2021 - American University | Math302 Final Exam_Graded A - American University
- Exam (elaborations) • 114 pages • 2022
- $12.99
- + learn more
MATH 302 Final Exam 2021 - American University QUIZ 1 Question 1 of 20 1.0/ 1.0 Points Which of the following statements are false regarding a boxplot? A. The height of the box has no significance. B. Boxplots can be used to either describe a single variable in a data set or to compare two (or more) variables C. The length of the box equals the range of the data. D. The right and left of the box are the third and first quartiles Answer Key: C Question 2 of 20 1.0/ 1.0 Point...
