MATH 533
DeVry
All 9 results
Sort by
-
Math 533 Quizzes + Final Exam
- Package deal • 7 items • 2019
- $65.15
- + learn more
MATH 533 Week 1 Quiz MATH 533 Week 3 Quiz MATH 533 Week 4 Quiz MATH 533 Week 5 Quiz MATH 533 Week 6 Quiz MATH 533 Week 7 Quiz MATH 533 Week 8 Final Solutions
-
Math 533 Quizzes Week 1, 3-7
- Package deal • 6 items • 2019
- $52.24
- + learn more
MATH 533 Week 1 Quiz MATH 533 Week 3 Quiz MATH 533 Week 4 Quiz MATH 533 Week 5 Quiz MATH 533 Week 6 Quiz MATH 533 Week 7 Quiz
-
MATH 533 Week 8 Final Solutions
- Exam (elaborations) • 8 pages • 2019
- $26.43
- + learn more
1. Question: The following numbers represent the weights in pounds of six 7-year old children in Mrs. Jones' second grade class (25, 60, 51, 47, 49, 45). Find the mean, median, mode, variance, and standard deviation. 2. Question: If the variance is 846, what is the standard deviation? 3. Question: If we have the following data: 34, 38, 22, 21, 29, 37, 40, 41, 22, 20, 49, 47, 20, 31, 34, 66. Draw a stem and leaf. Discuss the shape of the distribution. 4. Question: For two events, C and D, P(C) = ...
-
MATH 533 Week 7 Quiz
- Exam (elaborations) • 4 pages • 2019
- $7.09
- + learn more
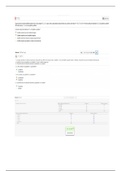
1. Question 12.3.4.T: Suppose you fit the first-order multiple regression model y = β0 β1x1 β2x2 Ԑ to n = 25 data points and obtain the prediction equation ŷ = -50.11 5.44x1 1.33x2. The estimated standard deviations of the sampling distributions of β1 and β2 are 0.98 and 0.25 respectively. 2. Question 12.3.13: Researchers developed a safety performance function (SPF), which estimates the probability of occurrence of a crash for a given segment of roadway. Using data on over 10...
-
MATH 533 Week 6 Quiz
- Exam (elaborations) • 40 pages • 2019
- $3.86
- + learn more
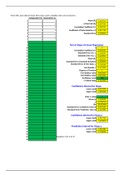
Simple Linear Regression Question: From MSL, open data in Excel, then copy x and y variables into correct columns.

And that's how you make extra money

-
MATH 533 Week 4 Quiz
- Exam (elaborations) • 5 pages • 2019
- $13.54
- + learn more
1. Question 6.2.4: A random sample of 89 observations produced a mean x̄ = 25.7 and a standard deviation s = 2.5. 2. Question 6.5.67: A company wants to test a randomly selected sample of n water specimens and estimate the mean daily rate of pollution produced by a mining operation. If the company wants a 95% confidence interval estimate with a margin of error of 1.6 milligrams per liter (mg/L), how many water specimens are required in the sample? Assume prior knowledge indicates that pollution...
-
MATH 533 Week 1 Quiz
- Exam (elaborations) • 9 pages • 2019
- $26.43
- + learn more
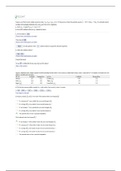
1. Question: 1.1.13 Suppose you’re given a data set that classifies each of simple unit into one of four categories. A, B, C or D. you plan to create a computer database consisting of these data and you decide to code the data as A = 1, B = 2, C = 3, and D = 4. Are the data consisting of the classifications A, B, C, and D qualitative or quantitative? After the data are input 1, 2, 3, and 4 are they qualitative or quantitative? 2. Question: 1.1.21 A company tracked all credit card purchases dur...
-
MATH 533 Week 3 Quiz
- Exam (elaborations) • 9 pages • 2019
- $13.54
- + learn more
1. Question: The ages of a group of 50 women are approximately normally distributed with a mean of 47 years and a standard deviation of 6 years. One woman is randomly selected from the group, and her age is observed. 2. Question: Almost all companies utilize some type of year-end performance review for their employees. Human Resource (HR) at a university Health Science Center provides guidelines for supervisors rating their subordinates. For example, raters are advised to examine their ratings f...
-
MATH 533 Week 8 Final Exam (Solutions Guide)
- Exam (elaborations) • 8 pages • 2019
- $29.02
- + learn more
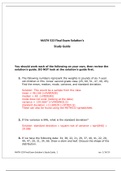
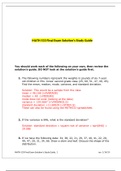
1. Question: The following numbers represent the weights in pounds of six 7-year old children in Mrs. Jones' second grade class (25, 60, 51, 47, 49, 45). Find the mean, median, mode, variance, and standard deviation. 2. Question: If the variance is 846, what is the standard deviation? 3. Question: If we have the following data: 34, 38, 22, 21, 29, 37, 40, 41, 22, 20, 49, 47, 20, 31, 34, 66. Draw a stem and leaf. Discuss the shape of the distribution. 4. Question: For two events, C and D, P(C...
